Learning to Turn Data into Stories That Create Change
Data: More than a Four-Letter Word
The week after every academic semester brings something many faculty dread: the anonymous student evaluations of the courses they just finished teaching. After nearly two decades of teaching in higher education, I try to read these evaluations with this mindset: just as my critical feedback on students’ writing presents an opportunity for them to learn and grow, students’ feedback on my teaching can help me make my courses better for the next group of students that takes the course.
In December 2025, I opened students’ evaluations of my course, Writing with Data (taught concurrently with a graduate-level section of the course) and started reading. Thankfully, the evaluations were very positive. Students wrote about how the course introduced them to valuable concepts and practices: how to interpret and describe data findings for real audiences, present data in visual and textual formats, and frame research findings to meet specific rhetorical goals. Whew! What a relief that most of my students learned and appreciated what I’d set out to teach them.
One student comment stood out to me. The remark came from a graduate student, who wrote that they initially dreaded the course because
"Data felt like a 4-letter word."
Despite this concern, the student wrote that the class served as one of the most challenging and rewarding courses they’d ever taken.
After reading this comment, I began reflecting on the expectations and concerns students might bring to a course called, “Writing with Data.” I started wondering if I should be doing more to explain the course to potential students and dispel myths or ease fears that might prevent them from enrolling. I’ll try to do that work in this blog post, and I hope you’ll reach out to me if this post doesn’t answer all of your questions.
What is the point of a course centered on writing about data?
Simply put, I aim to teach students the core principle presented in the course’s primary textbook, Writing about Data by Joanna Wolfe (2025):
"Numbers do not speak for themselves."
Writers who use quantitative and/or qualitative data in their work must do the heavy lifting of interpreting and presenting data clearly to audiences. They must review their dataset(s) multiple times, identify the “stories” data can tell, and tell clear data stories their target audience(s) can understand and use.
How? Research writers must first analyze what their audience(s) might already know about the topic or dataset. For example, expert audiences might not need to read a detailed explanation of a common methodological approach used in their field, whereas nontechnical audiences from outside that field might need a full explanation.
The bottom line: research writers bear the responsibility of figuring out what their audience(s) need and want from the text.
Beyond analyzing audience needs, I often remind my students,
"Readers are lazy."
Why? To be fair to all of us who read, we are inundated every day with many texts and modes of communication—from traditional print texts like flyers, magazines, and books to social media posts and video reels to text messages and emails. Unsurprisingly, readers aren’t likely to struggle through a confusingly complex or jargon-filled document—no matter how motivated they might be to learn about the topic or issue.
In Writing with Data, my students learn how to make data stories clear and engaging to various audiences: how to phrase data-based findings for different types of texts, how to create data visualizations like charts, graphs, tables, and infographics, and how to write about data in modern digital texts and traditional print documents.
What types of projects do students complete in Writing with Data?
The course is split into two units, and students write, design, and present a few documents for each unit. Because the course includes upper-level undergraduates and graduate students, the graduate students do a few extra assignments.
In Unit 1, students explore a local or campus problem using secondary sources of data, and they present the problem to relevant audience(s) in two texts:
Research-based Blog Article and Data-based Infographic
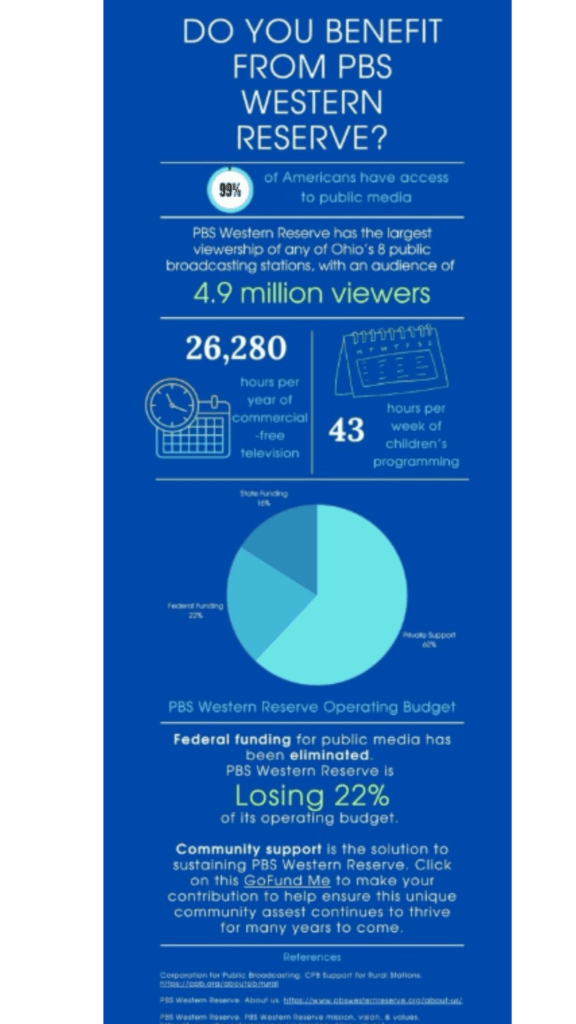
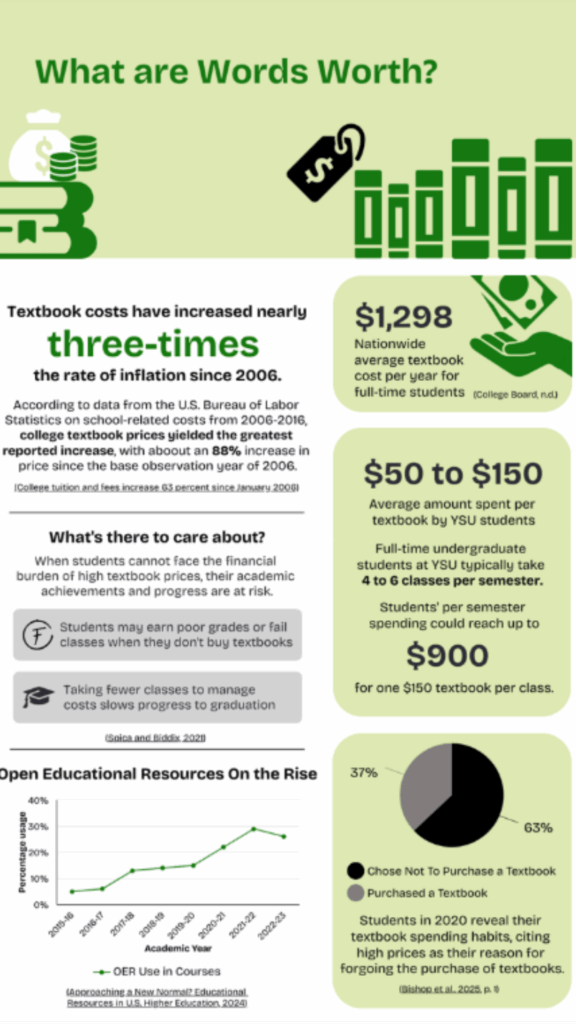
For this project, recent students have explored problems like the waning readership of The Jambar, housing insecurity in Youngstown, the declining participation in local 4-H programs, and the barriers local high school students face in participating in speech and debate. For this project, students construct data-based infographics, such as these examples below from two graduate students in the class:
Infographic created by graduate student, Jenny Tullis
Infographic created by graduate student, McKenzie Davis
In this first unit, students continue their research by examining what can be done to solve the problem. They conduct research on how other communities and campuses have addressed similar problems, and they investigate the likely costs associated with solving the problem. Then, they write the following texts:
crowdfunding campaign page and donor funding letter
In Unit 2, students explore a different local or regional problem in more depth by collecting, analyzing, and synthesizing both primary and secondary data to present the problem and potential solutions to target audiences:
recommendation report and research poster presentation
In this project, students take a deeper dive into real problems that matter to them. They collect and write about primary data—surveys or interviews, observational data, archival or governmental data, and/or online community data. They also collect and analyze secondary sources—from published scholarly articles and books to journalistic reports, trade-journal articles, think-tank reports, and government publications.
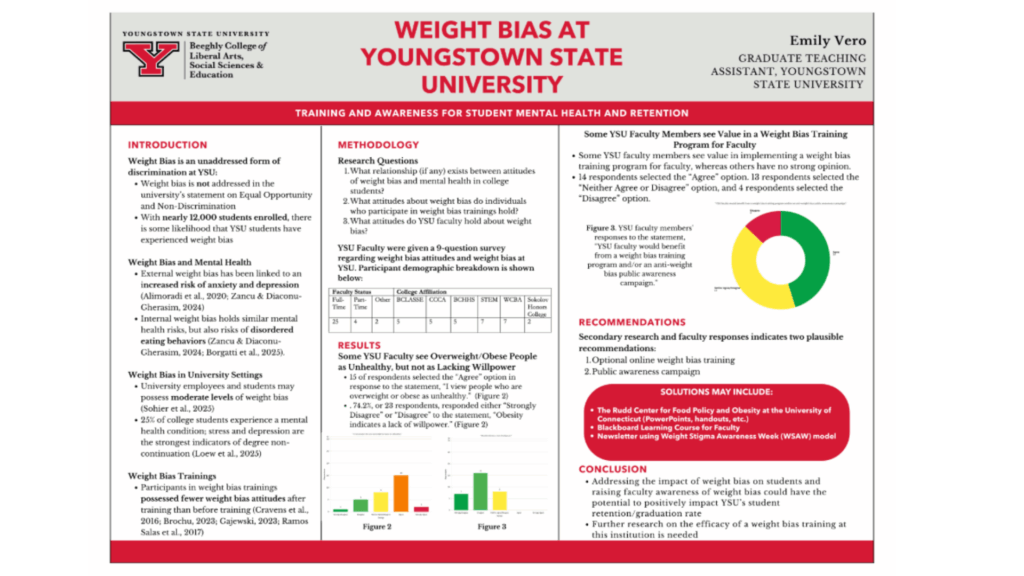
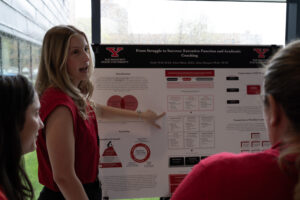
Recent students have explored issues like brain drain in Youngstown, vaping awareness among YSU students, and access to spaces for religious expression on our campus. Students present the results of their recommendation reports to our class in research poster presentations. They envision an audience of local stakeholders who can contribute to solving the problem. Here is an example of a graduate student poster:
Research Poster created by graduate student, Emmy Vero
What do students think about Writing with Data?
"At the start of this class we discussed the phrase ‘data illiterate,’ which is a term I strongly resonated with. After taking this course, I have found it easier to comprehend different forms of data.” – Anissa Al-Ka’rain, graduate student
“I have a better understanding on how visual tables and graphs can be used to communicate data, how to target an audience with my data, and [what] visual techniques to use in those visual aids or in text.” – Jenny Tullis, graduate student
“The class makes students gather their own primary data, which is a valuable skill undergraduates should not miss out on. I learned about the IMRaD writing format and finally felt like research papers were explained in a detailed way that was easy for me to understand.” – Dino Urichko, undergraduate student
“I now understand how to interpret data I’ve collected into a story that (tries to) cohesively communicate the purpose and to use the stories to promote action or further research on problems with real-life consequences.” – Katelyn Obermiyer, undergraduate student
What programs include the writing with data course?
I hope at this point in this blog post you want to know what programs and certificates include Writing with Data (ENGL 3744orENGL 6942).Writing with Data can be taken alone for any program or can be taken to fulfill requirementsfor the following majors, minors, and certificates:
Undergraduate Certificate in Professional Writing (coming soon)
I hope to see you in my classroom the next time Writing with Data is offered. Please reach out to me with any questions or comments. I can’t wait to talk with you.
— Diana Awad Scrocco, Professor of English and Coordinator for Professional Writing, Youngstown State University